Clone, run, and explore this sample
This is a simple .NET app that shows off collecting metrics with OpenTelemetry and exporting them to Prometheus and Grafana for reporting.
The entry point that composes every resource and dependency in this sample's distributed application.
using MetricsApp.AppHost.OpenTelemetryCollector;
var builder = DistributedApplication.CreateBuilder(args);
var prometheus = builder.AddContainer("prometheus", "prom/prometheus", "v3.2.1")    .WithBindMount("../prometheus", "/etc/prometheus", isReadOnly: true)    .WithArgs("--web.enable-otlp-receiver", "--config.file=/etc/prometheus/prometheus.yml")    .WithHttpEndpoint(targetPort: 9090)    .WithUrlForEndpoint("http", u => u.DisplayText = "Prometheus Dashboard");
var grafana = builder.AddContainer("grafana", "grafana/grafana")    .WithBindMount("../grafana/config", "/etc/grafana", isReadOnly: true)    .WithBindMount("../grafana/dashboards", "/var/lib/grafana/dashboards", isReadOnly: true)    .WithEnvironment("PROMETHEUS_ENDPOINT", prometheus.GetEndpoint("http"))    .WithHttpEndpoint(targetPort: 3000)    .WithUrlForEndpoint("http", u => u.DisplayText = "Grafana Dashboard");
builder.AddOpenTelemetryCollector("otelcollector", "../otelcollector/config.yaml")    .WithEnvironment("PROMETHEUS_ENDPOINT", $"{prometheus.GetEndpoint("http")}/api/v1/otlp");
builder.AddProject<Projects.MetricsApp>("app")    .WithEnvironment("GRAFANA_URL", grafana.GetEndpoint("http"))    .WithUrlForEndpoint("https", u => u.DisplayText = "Instrumented App")    .WithUrlForEndpoint("http", u => u.DisplayLocation = UrlDisplayLocation.DetailsOnly);
builder.Build().Run();
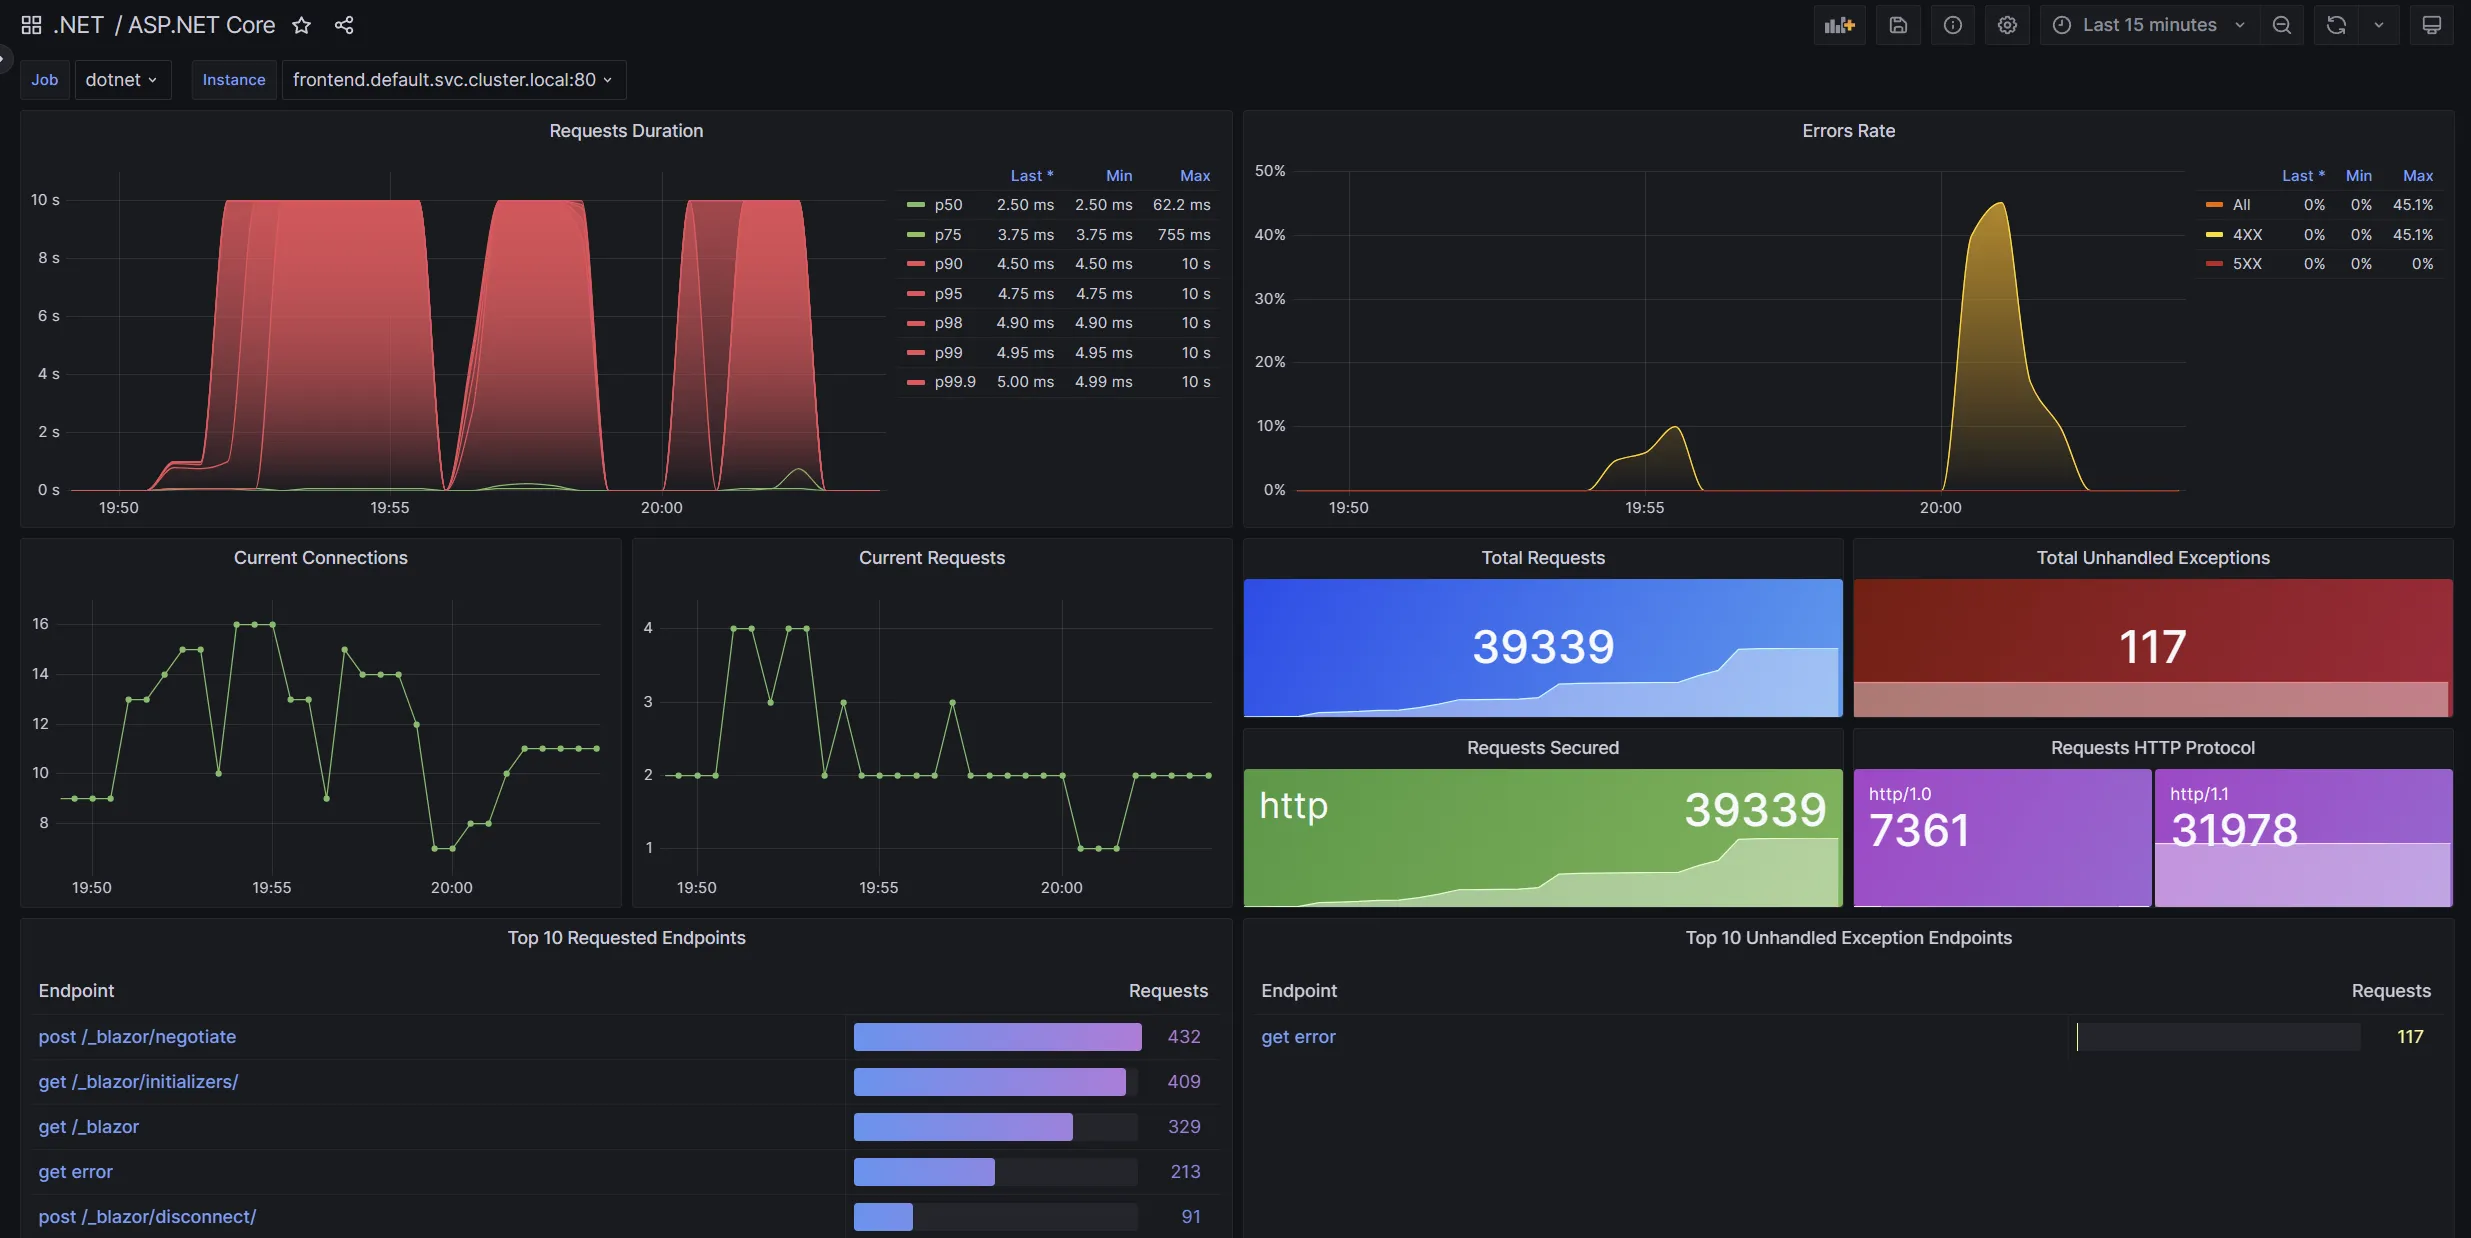
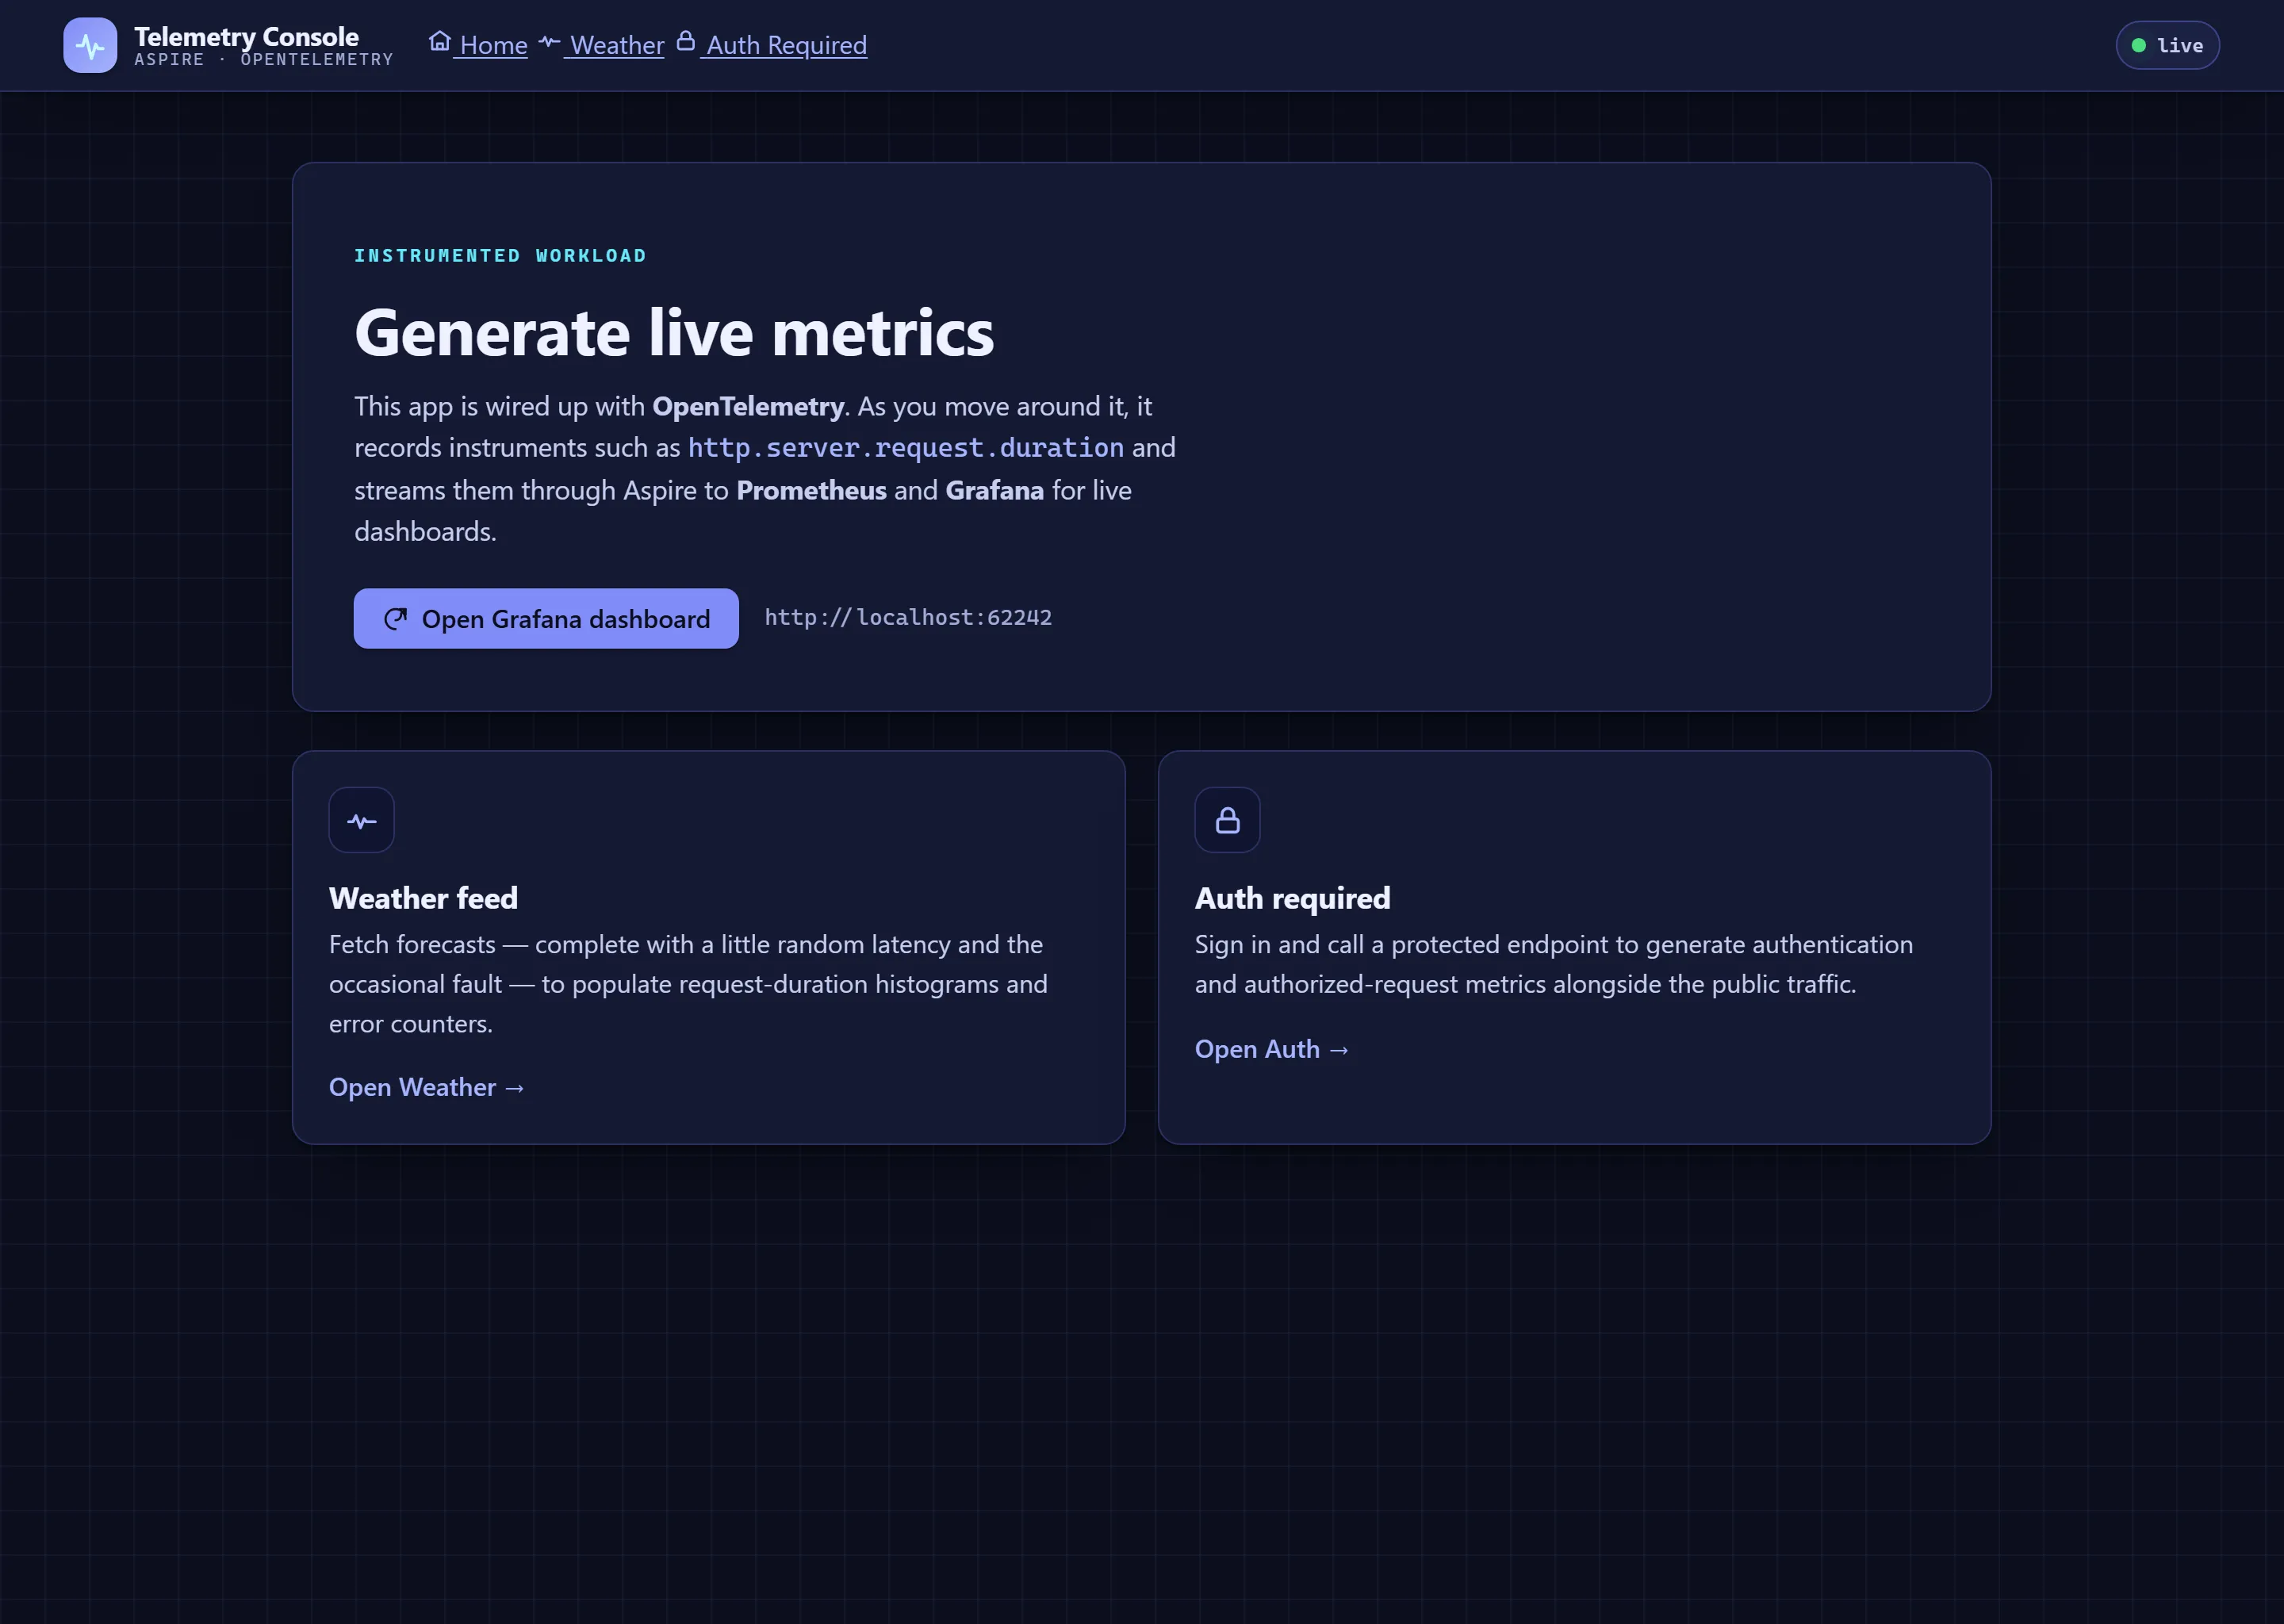
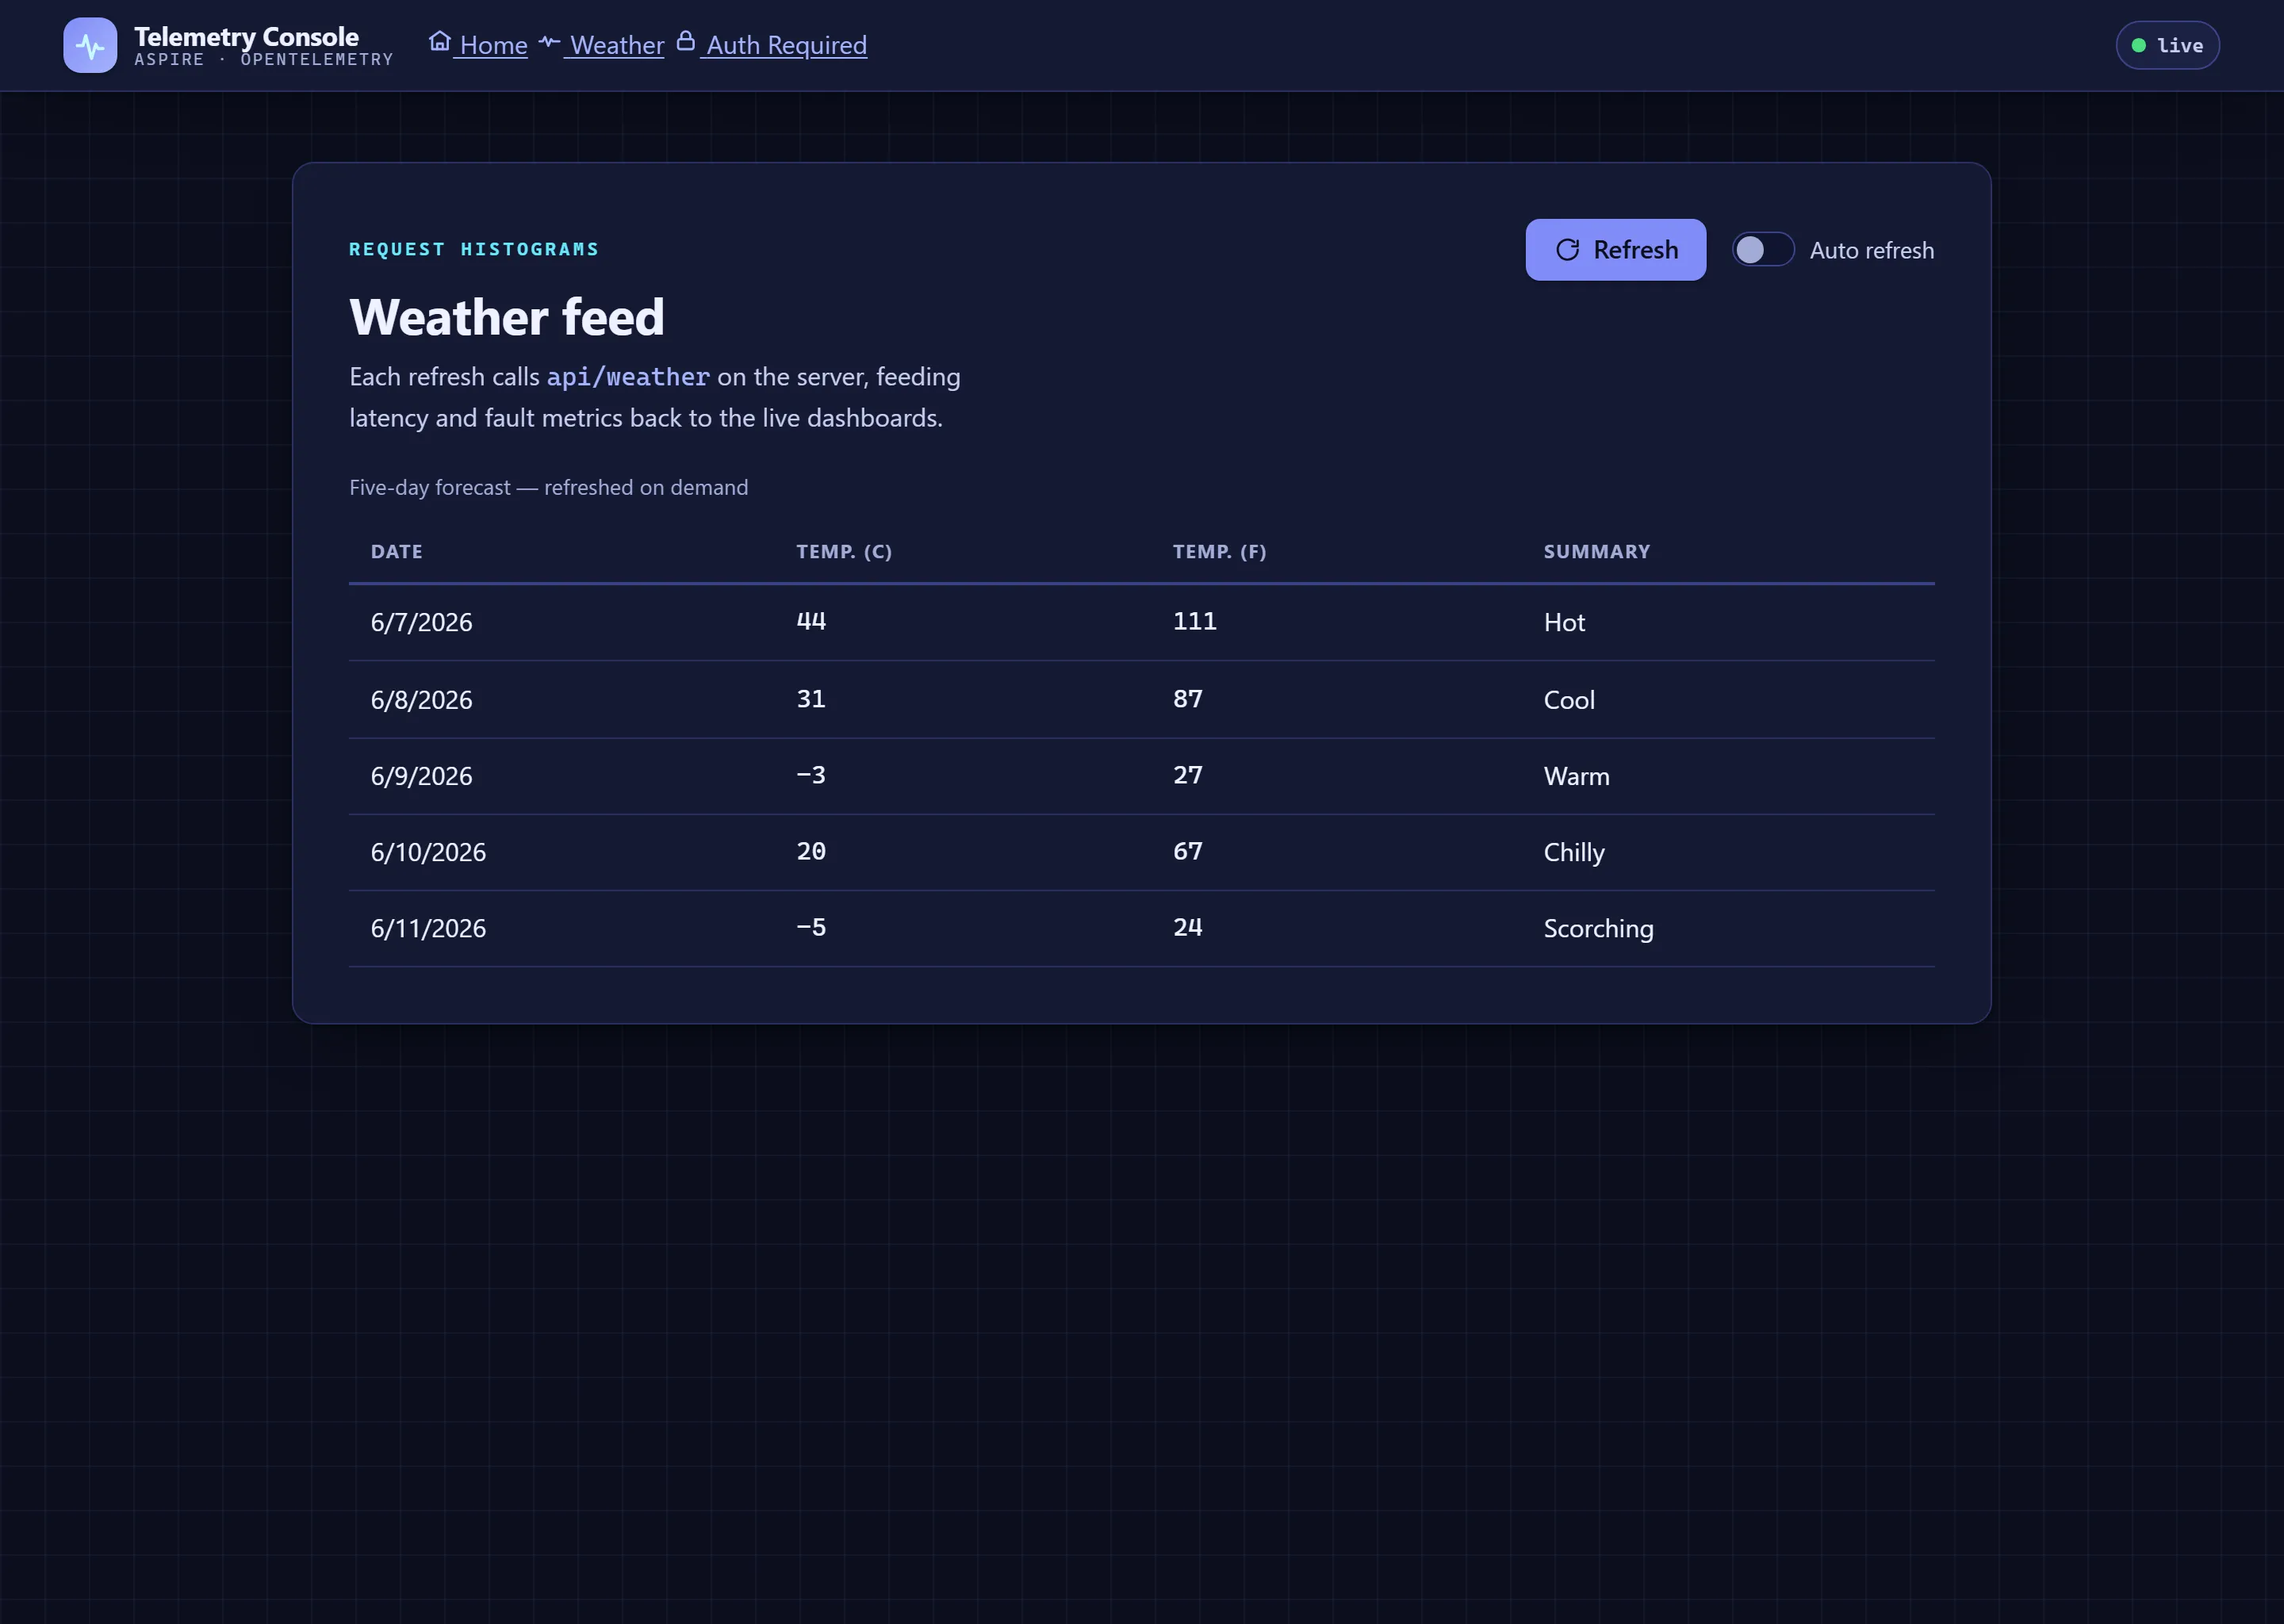
The instrumented app is a small web UI that emits OpenTelemetry metrics. Click around it — the Weather feed and the Auth Required flow — to generate the request traffic that shows up on the Grafana dashboard above. It supports both light and dark themes:
Demonstrates
Section titled DemonstratesHow to configure an Aspire app to export metrics to Prometheus
How to add Prometheus and Grafana containers to an Aspire app
How to configure Prometheus and Grafana to collect and display metrics in the .NET Grafana dashboard
Sample prerequisites
Section titled Sample prerequisitesThis sample is written in C# and targets .NET 10. It requires the .NET 10.0 SDK or later.
Running the sample
Section titled Running the sampleIf using the Aspire CLI, run aspire run from this directory.
If using VS Code, open this directory as a workspace and launch the MetricsApp.AppHost project using either the Aspire or C# debuggers.
If using Visual Studio, open the solution file Metrics.slnx and launch/debug the MetricsApp.AppHost project.
If using the .NET CLI, run dotnet run from the MetricsApp.AppHost directory.
On the Resources page, click the URLsfor the instrumented app. This launches the simple .NET app.
In the instrumented app:
Visit the Weather and Auth Required pages to generate metrics. Values will be captured for
http.server.request.durationand other instruments.On the Home page, click the Grafana dashboard link. This launches the ASP.NET Core dashboard in Grafana.
Play around inside the Grafana dashboard:
Change the time range.
Enable auto-refresh.
Click route links to view detailed information about specific areas in the ASP.NET Core app.
For more information about using Grafana dashboards, see the Grafana documentation.
Sample screenshots
Select an image to zoom in.